Maximum Temperature and Latitude
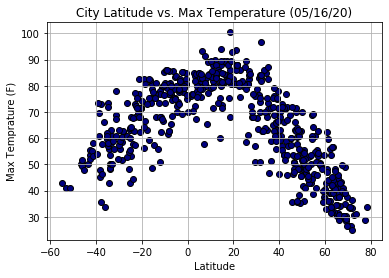
This graph shows that the closer an area is to zero degrees latitude, the higher the temperature would be. By viewing this graph, we could tell that cities in the area around zero degrees are mostly having high temperatures in both the north and south hemisphere. Based on this graph, it shows that both poles have the lowest temperatues. The temperature rises following by the increase of latitudes. By viewing the density of cities on the graph, we could possibly conclude that the zero degrees area has a higher desity of cities which might illustrate that areas around zero degrees are moer habitable. Click the navigation bar or images below for more graphs and analyses.